

We are continuously improving the tools to help you troubleshoot usage. Please contact us if you have any feedback or need help understanding or managing your usage.
Usage and Billing Metrics FAQs
Where can I review my PowerSync Service usage?
Where can I review my PowerSync Service usage?
You can track usage in two ways:
- Individual instances: Visit the Usage metrics workspace in the PowerSync Dashboard to see metrics for a specific instance.
- Organization-wide: Go to your organization in the PowerSync Dashboard and check the Plan Usage section for aggregated metrics across all instances in your current billing cycle.
What are concurrent clients?
What are concurrent clients?
A concurrent client is an active SDK sync connection to the PowerSync Service. Think of this as the number of open sync connections, not necessarily your total number of users or app installations. Calling
.connect() opens one long-lived connection that streams updates.Key points about concurrent clients:- Billing is based on peak concurrent clients, which is the highest number of simultaneously connected clients during the billing cycle.
- Billing (Pro/Team): 1,000 clients are included, then $30 per 1,000 over the included amount.
- The PowerSync Cloud Pro plan is limited to 3,000 concurrent clients.
- The PowerSync Cloud Team plan is limited to 10,000 concurrent clients by default.
- The PowerSync Cloud Free plan is limited to 50 peak concurrent clients.
- When limits are reached, new connection attempts receive a 429 HTTP response while existing connections continue syncing. Clients retry after a delay and should connect once capacity is available.
What is data synced?
What is data synced?
Data synced measures the total uncompressed size of data synced from PowerSync Service instances to client devices. Each transfer counts. If the same 1 MB of data syncs to 100 devices, it contributes 100 MB to data synced.Billing (Pro/Team): 30 GB included, then $1.00 per GB over the included amount.For ways to lower this metric, see Reducing Usage.
What is data hosted?
What is data hosted?
Data hosted is not a direct copy of your source database. The PowerSync Service hosts three types of data:
- A current copy of the data, which should be roughly equal to the subset of your source data covered by your Sync Streams (or legacy Sync Rules).
- An operations history for data in buckets, which can be larger than the source data because one row can be in multiple buckets.
- Data for parameter lookups, which is typically small.
What are sync operations?
What are sync operations?
A sync operation occurs when a single row is synced from the PowerSync Service to a user device. You can think of the operations history as a log of row changes. If one row changes 20 times, it can add 20 operations until compacting reduces that history.The PowerSync Service keeps an operations history so clients can download incremental changes. This means:
- Changes to selected rows create operations, and the history can grow over time.
- During its initial sync, a client downloads the current operations for its subscribed buckets.
- Existing clients only download new operations since their last sync.
- Daily automatic compacting (built into PowerSync Cloud)
- Targeted defragmentation when old operations prevent effective compacting
What is the difference between data replicated and data synced?
What is the difference between data replicated and data synced?
Data replicated travels from your backend source database (Postgres, MongoDB, MySQL, SQL Server, or Convex) to the PowerSync Service. It is not billed.Data synced travels from the PowerSync Service to client devices. It is used for billing.
Billing FAQs
Where can I see details about my current billing cycle?
Where can I see details about my current billing cycle?
Go to your organization in the PowerSync Dashboard and open the Plan Usage section. This shows your total usage (aggregated across all projects) for your current billing cycle. Data updates once a day.
Where can I update billing details such as the email that receives receipts?
Where can I update billing details such as the email that receives receipts?
Update your billing details in the Plans & Billing section of the PowerSync Dashboard at the organization level.
Can I view my historic invoices?
Can I view my historic invoices?
Review your historic invoices in the Stripe Customer Portal by signing in with your billing email here.
Which usage metrics are billed?
Which usage metrics are billed?
The Pro and Team plans bill the following metrics. Check the pricing page for current rates and limits.
- Data synced: 30 GB included, then $1.00 per GB over the included amount.
- Peak concurrent clients: 1,000 included, then $30 per 1,000 over the included amount.
- Data hosted: 10 GB included, then $1.00 per GB over the included amount.
- Replication operations (count)
- Data replicated (per GB)
- Sync operations (count)
Usage Troubleshooting
If you’re seeing unexpected spikes in your usage metrics, work through this section to find where they come from. Once you know the cause, Reducing Usage covers the changes that bring usage down. If your usage is consistently high rather than spiking, start there directly.Troubleshooting Strategies
Use these strategies to narrow down the source of a spike. Sync operations are not billed, but they show how much row-level activity sits behind data synced. The shape of the spike usually points to the cause: many operations suggest row churn or bucket fan-out, large transfers with fewer operations suggest large rows, and repeated sessions from one client suggest a connection or local storage issue.Identify Timing
Use Usage metrics to pinpoint the exact hour or day of a spike, then check what happened around that time: a Sync Streams deployment, a batch job on your source database, defragmentation, or a group of new users onboarding.Review Instance Logs
Use Instance logs to review sync service activity during the spike(s). In the Search input, query"sync stream complete" to find entries showing how many operations synced, the size of data transferred, and which clients and users were involved.
Narrow the results with structured filters:
- Type a filter in the Search input, such as
user_id:<user-id>,rid:<request-id>, orerror:PSYNC_S2001. - Click Property filters next to the search input and choose a property, such as User ID, Client ID, Request ID, or Error code. Error code and Close reason offer a list of known values.
- Click any metadata pill on a log entry and choose Add filter to pin that value as a filter. This is useful for following
user_id,client_id, or customapp_metadata_*log properties without typing.
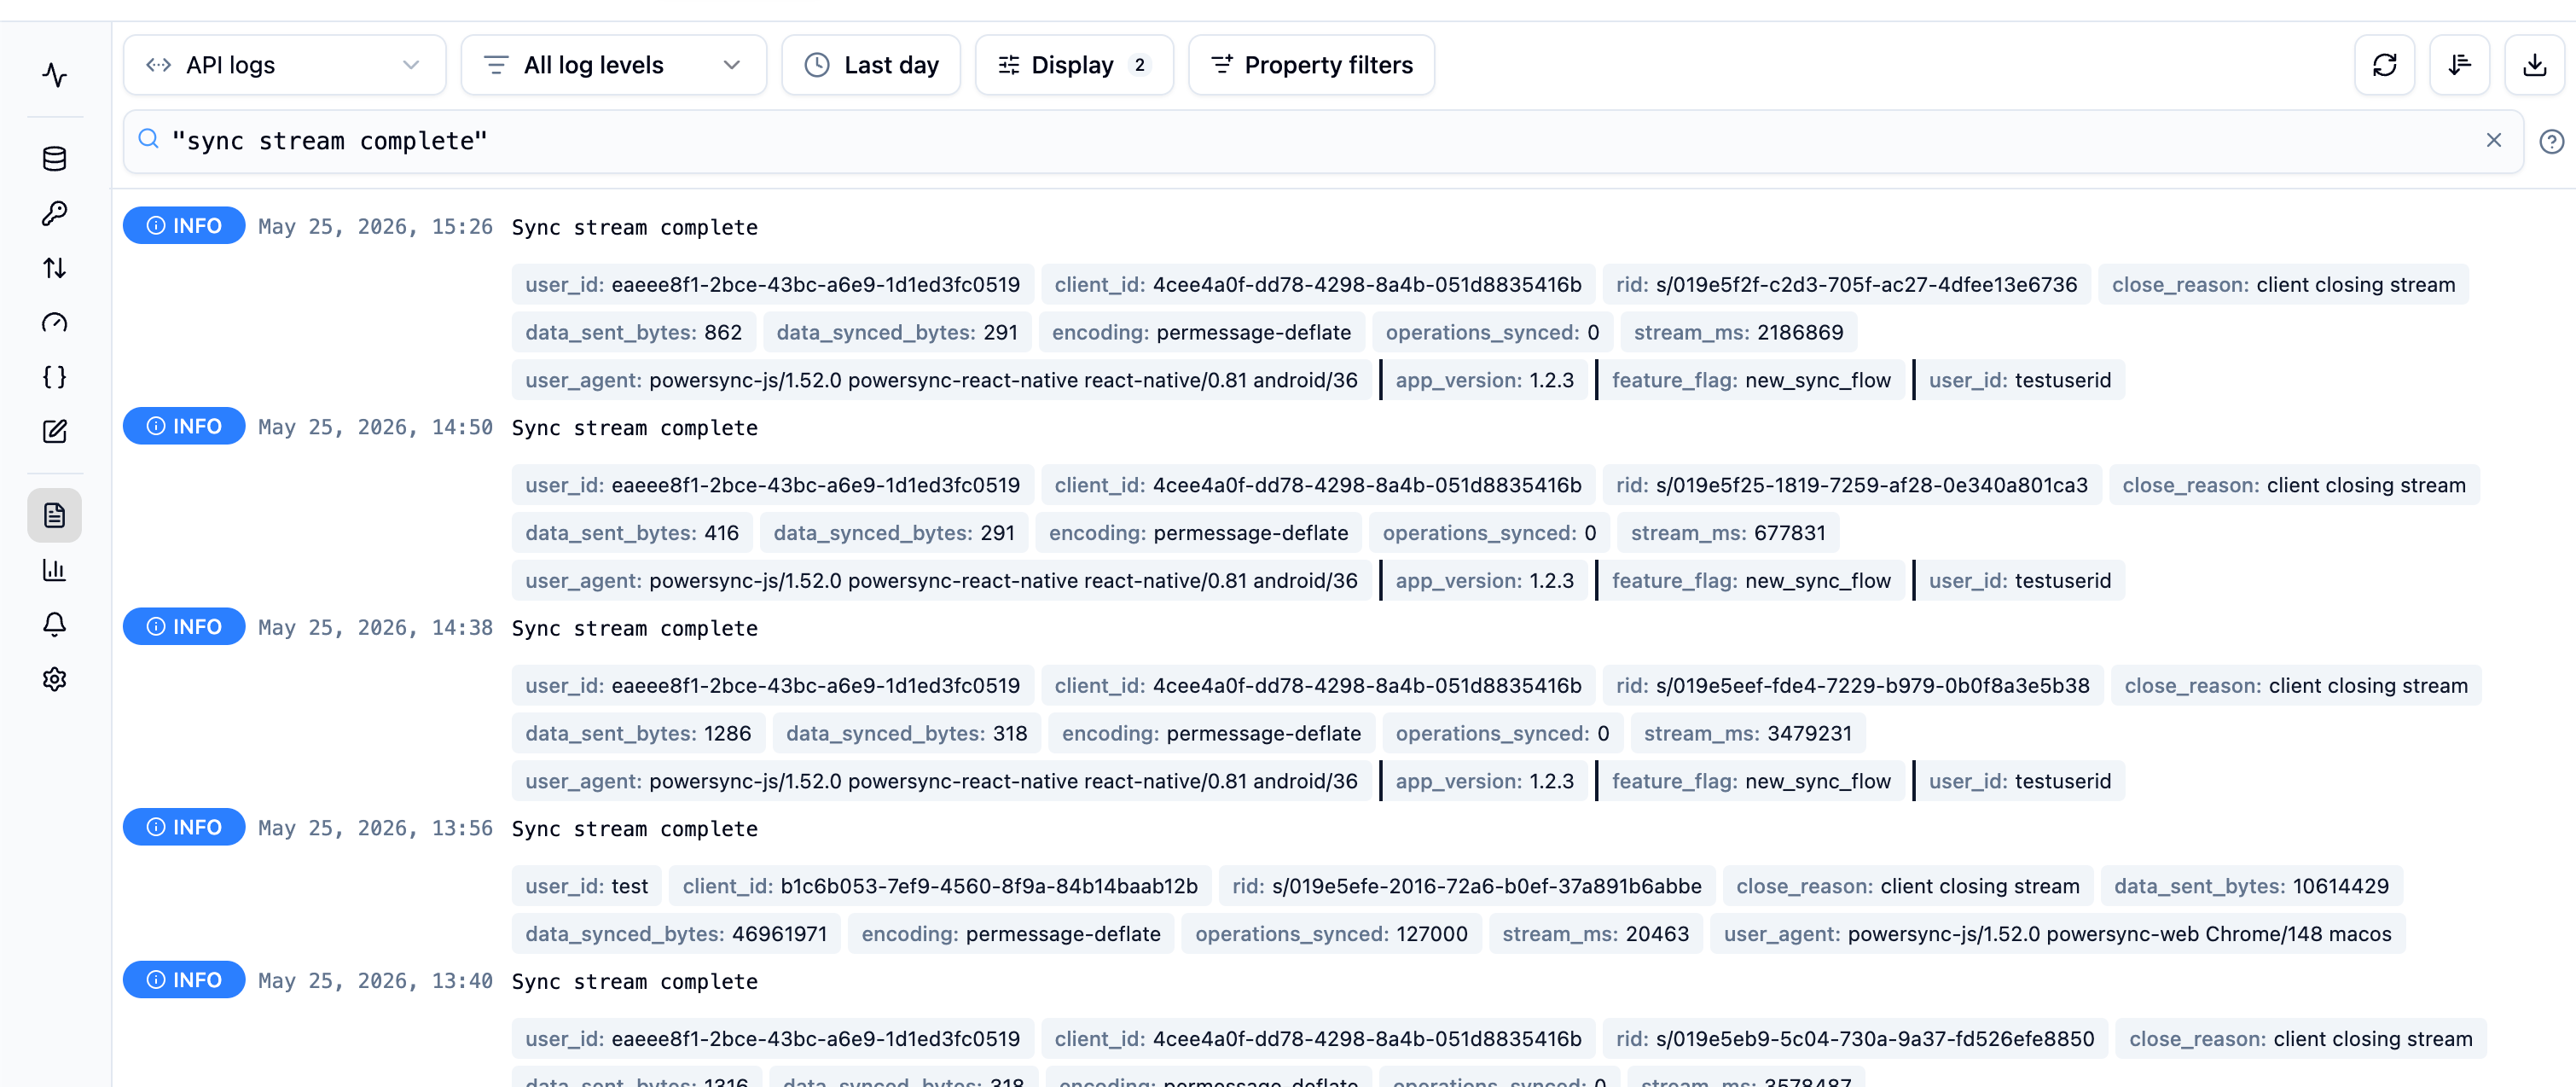
Example of 'Sync stream complete' logs filtered in the dashboard
Compare Rows vs. Operations
Use the Sync Diagnostics Client to compare total rows with operations synced to a user device. Significantly more operations than rows can indicate a large operations history or bucket fan-out. See More Operations Than Rows.Common Usage Patterns
More Operations Than Rows
If a device syncs significantly more operations than rows, it is downloading more than one operation for some current rows. This usually means a large operations history has built up. For example, a row that changed many times can have several operations in the history even though the client ends up with only its latest value. Bucket fan-out causes the same symptom for a different reason. A row is stored and synced once for each bucket it belongs to, so a row in ten buckets produces ten copies of its operations. To reduce the operations history, see Compacting and Defragmenting. If rows belong to many buckets, see Reducing Bucket Fan-Out.Repetitive Syncing by the Same User
If the same user or client appears in"sync stream complete" log entries in quick succession, investigate the client connection lifecycle. Reconnecting does not normally cause a full download because the client resumes from its saved sync position. The amount downloaded in each session tells you what to investigate:
- Confirm you’re using the latest SDK version.
- Check your client-side logs for connection issues or sync loops.
- Compare the operations and data downloaded by each session. Repeated large downloads indicate that the client may be losing or clearing its local database; see Avoiding Unnecessary Full Re-Syncs. Frequent sessions with small downloads point to unnecessary reconnects, but do not by themselves explain a large data synced total.
Large Rows
If operation counts are moderate but data synced is high, each operation is probably carrying a large row. Long TEXT or JSON columns and embedded files can make a small number of operations transfer a large amount of data. Check typical row sizes for your frequently updated tables. Keeping Large Files Out of Synced Rows covers how to move that data out of synced rows.Spikes That Match Batch Jobs
If spikes recur on a schedule, compare their timing with jobs on your source database. A nightly job that rewrites a selected table can create new operations for every affected row, even when selected values do not change. Active clients then download those operations. See Writes That Do Not Change Data.Concurrent Clients
Each connectedPowerSyncDatabase counts as a concurrent client. If one user session opens three database instances and calls .connect() on each, that session can use three concurrent clients. Review your connection lifecycle and instance logs. Open only one connection for each user session unless your app requires more.
Expected Temporary Increases
Some events increase usage temporarily and don’t indicate a problem:- New app installations download all their subscribed data, including the operations history, during the initial sync. Expect higher data synced when onboarding new groups of users. A large operations history makes these initial syncs bigger; see More Operations Than Rows.
- With incremental reprocessing (currently in Beta; supported only with Sync Streams, a MongoDB source database, and MongoDB bucket storage), changing one independent stream does not make clients download every other stream again. PowerSync keeps the current sync data while it prepares your changes, so data hosted can still increase temporarily. Without incremental reprocessing, PowerSync prepares a complete new set of sync data and clients download all data selected by the new config again. See Deployments.
- Defragmentation reduces what new installations download, but existing clients re-sync each touched row.